Faculty Tutorial: Plagiarism in Graphs, Charts, Figures or Images
Definition
Using graphs, charts, figures, or images from a source without acknowledging that another person developed them is considered plagiarism.
Example Source
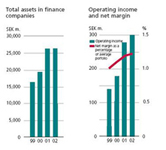
Source: Scania. Annual Report 2002. 2003. 31 Aug. 2005.
Draft
Scania is a Scandinavian company that manufactures parts for large semi-trucks. The company's profits have been rising steadily throughout the years, as can be seen in the table below.
Explanation
This writer has lifted a table from a secondary source and used it directly in their draft. By doing this, the writer has used another person's ideas, calculations, and words without acknowledgement. This lack of citation constitutes plagiarism.
To eliminate this type of plagiarism, you should provide a citation for any tables, graphics, figures, or images you acquire from secondary sources. You may also consider translating the information from tables into your own words. Remember, even if you use only information from a graph, chart, figure, or image in your paper, you still need to acknowledge your source by providing proper citation.

The Academic Integrity Tutorial for Students is licensed under a Creative Commons Attribution-NonCommercial-ShareAlike 4.0 International License.